

For data nerds out there, this must be familiar – but for those who haven’t seen Canada’s population clock from StatsCan, you must check it out. Fascinating, and a little spooky.
Click to see it in real-time action.
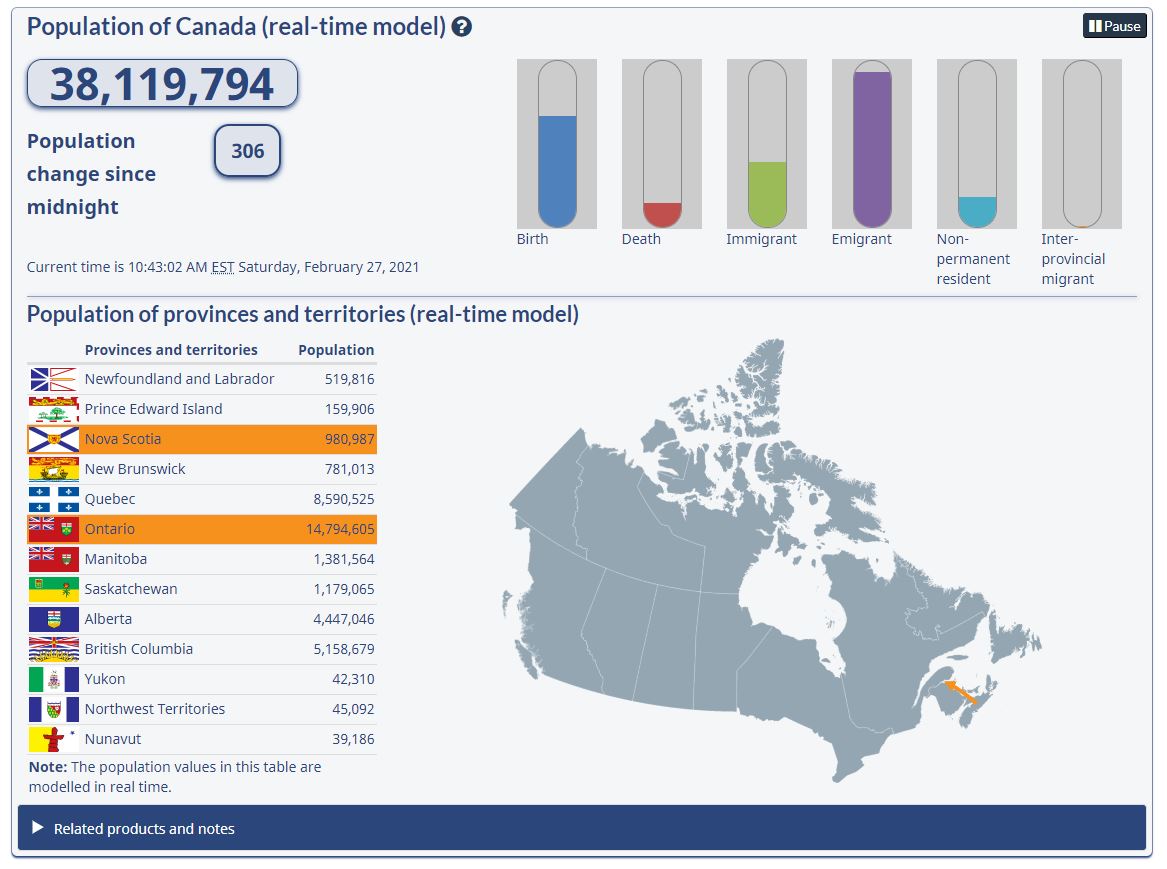
This population clock models in real time changes to the size of the Canadian population and the provinces and territories. However, population estimates and Census counts are the measures used to determine the size of the population in the context of various governmental programs.
Spooky? When a single death occurs, the province in which it occurs lights up in red, and you can watch the total change. A case where a statistic can be a tragedy.
There are all kinds of fascinating shifts in the data, like this:
10:43:02 AM EST: 1 interprovincial migrant, from Nova Scotia (population: 980,987) to Ontario (population: 14,794,605)
It provokes questions you’d like answers for: Why are there (at least at this moment) seemingly way more emigrants than immigrants? Where are they going? And why is there one ‘m’ in emigrant and two in immigrant?
Observations welcome.


