

You want data on housing? The City has data on housing – 150 pages worth.
And hence the problem. Who is going to skim that amount of information, much less take the time to find the specific data they need if it’s not searchable on something other than a dense pdf document? For that matter, for a topic on everyone’s tongue, how many people even know there is a “Housing Vancouver Strategy”, much less what it aims to achieve?
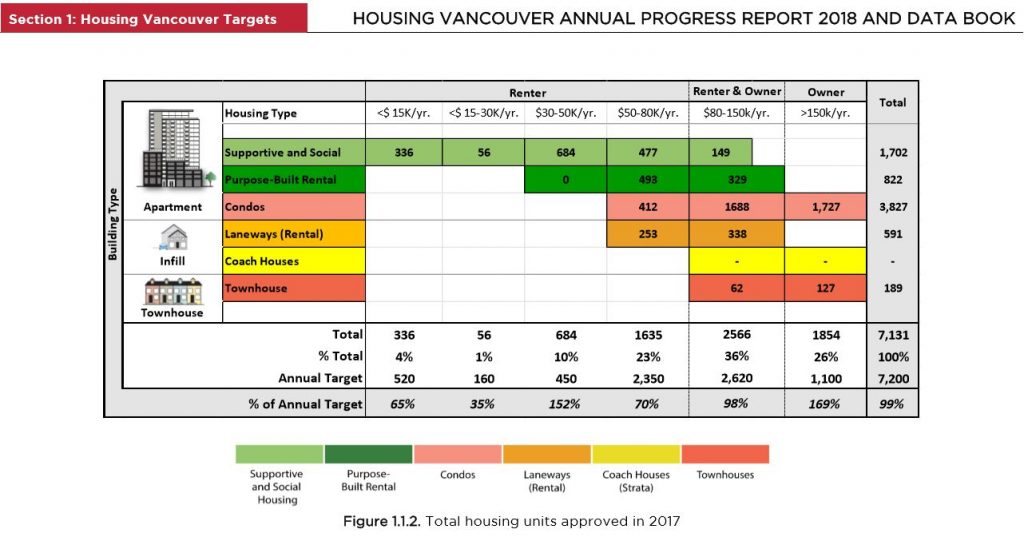
The answer to that question, by the way, is condensed into this table:

After the executive summary, there is page after chart after table after map of data on how the City is performing – like this:

Information like this would go a long way to helping us all understand the existential issue we face and how it’s changing. (I’d maintain that the ‘housing crisis’ of the last decade is already over, in the sense that fundamentals have already shifted, even if the consequences are not yet apparent. But are there indications in the data that this happening? Probably it’s in this book.)
So here’s a challenge to PT readers. Check out the data book, and see if you can find a snippet or a chart or a map that you find particularly revealing. Then in Comments below, explain its significant and identify the page. Don’t let valuable data go to waste!


What on earth are “culturally appropriate” affordable homes?
And in 2018 their Executive Summary starts with pablum like this “There are signs that speculative investment may be
contributing to housing demand in the City.”?! Gee, d’ya think?
The evidence is leaning toward the larger effects of local “speculation” over foreign speculation. The change in mortgage testing rules bear this out. In other words, anyone lending private money to their kids today for a larger down payment today when applying for smaller mortgages could have the invective “speculator” thrown at them. Same thing applies to old timers who waited until the prices of detached homes hit the sky before selling could be called “speculators.” Anyone who owns any property anywhere in practically all of BC up to just a few months back when prices were still climbing just for being part of the market could have the handle “speculator” thrown at them even if they never ever want to sell their family home.
The fact remains it was obvious even to a blind beggar that speculation was fuelling the Vancouver real estate market, yet this Vision-driven document cannot admit it outright.
Two charts on p. 44 and 45 (Stock of Rental Universe by Building Age) give some interesting insight on the origins of our purpose build rental housing, which is still some of the most affordable rental in Vancouver. You can see the golden age of rental construction was in the 50s-70s in our ‘multifamily’ neighborhoods – the West End, Kits, Mount Pleasant, and Marpole – with a subsequent plummet in rental construction corresponding with the introduction of the Strata Act. We’re finally seeing the beginning of a potential catch-up thanks to new incentives and (most likely) rising rents making rental a viable product in the eyes of industry. Maybe in a couple decades, this housing will be a new iteration of today’s 1960s four-storey walk up.
I’m interested in the reported construction costs pp 77 and 78, I wonder if Michael Geller or Thomas Beyer would agree with those per square foot numbers.
Shocked to see only 1% of rental stock is 3 or more bed homes. No wonders there are lots of stories of families leaving.
On p. 46 – Figure 2.2.5. Estimated stock of purpose-built market rental housing by bedroom count, 2017.
Although only a small proportion of Vancouver’s purpose-built rental stock built to date consists of 2 and 3 bedrooms, rental developments in recent years have delivered a higher percentage of these units, at least in part due to an emphasis made by the City to require more family housing.
Figure 1.1.10 on p. 16 illustrates that of the total 822 new market rental units approved from 2017-2018, 40% have been delivered as family-sized units with 30% two-bedroom and 10% three-bedroom units. Of the total 1,702 social, supportive and co-operative housing units approved from 2017-2018, 26% have been delivered as two-bedroom and 15% have been delivered as three-bedroom units.