
When I was called up by a reporter to comment on the travel-to-work stats released the other day, the storyline had already been set. Somehow transit was failing because there wasn’t a big shift upwards in its percent of users. Conclusion: people prefer to drive, as bluntly stated in a celebration of selfishness by Sun columnist Shelly Fralic:
I commuted by car to downtown Vancouver for more than 30 years, all through the guilt-laden entreaties and HOV lanes and the West Coast Express and billion-dollar transit infrastructure expansions foisted on my green consciousness courtesy of local transit authorities.
In this, I am not much different from the many Metro Vancouverites — indeed, Canadians — who commute alone in their cars every day, mostly to and from their workplaces between downtown cores and growing suburbs, a reality once again bolstered this week by the latest Statistics Canada census figures. Of the 2.1 million of us commuting to our jobs around Metro Vancouver in 2011, a majority — 66 per cent — took solitary drives, while just under 20 per cent used public transit*.
I no longer commute, having worked from home for the past decade, but it’s not hard to figure out why we’re immovable, even though driving one’s own car to work alone is expensive, utterly selfish and decidedly anti-environmental.
Here’s the problem: When transit is successful, the benefits are almost invisible and the growth in use is discounted.
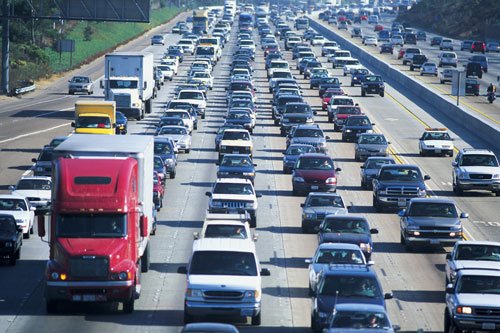
The SkyTrain Expo Line carries more than 13,000 persons into the downtown core during the weekday peak in those relatively small, short trains. Barely noticeable from a distance. But that volume in private cars would look like this**:
.
Six lanes of congested freeway.
In the peak three hours (6-9am), the SkyTrain carries approximately 26,000 persons. Where would that traffic go? Where would you park an extra 22,000 cars? Perhaps a 220-storey parkade if you could fit 100 cars per level?
Add in Canada Line for another 5,000 persons in the peak hour (three freeway lanes in the peak direction) or 9,000 persons over three hours, representing another 8,000 cars into downtown.
And West Coast Express adds another 2,800 in the peak hour, 5,800 over the three-hour peak.
So the argument usually goes like this: drivers should support transit because it keeps other cars off the road and reduces the need to build expensive highway capacity.
But the way that non-urban politicians usually think when they see stories that support the idea that everyone prefers to drive is this: provincial money should be dedicated for roads; transit will have to be paid for by local ratepayers. It does not typically occur to them that there is no way to build sufficient roads to handle the growth in demand if there was no provision for an effective transit system that accommodated a big percentage of the growth induced by the highway expansion.
But that’s the way it’s shaping up as we move towards a referendum (505 days to go!).
Imagine this scenario: The Province moves forward on the Massey Tunnel, and you can bet, if past practice is followed, that there will be no money in that budget for the actual provision of transit. So with the expansion of suburbia, port and border traffic, and the gigantic Tsawwassen Mills centre induced by the new tunnel or bridge, the result will be more lanes of traffic, much of which will use Oak Street.
What then? Will the Province rebuild Oak Street Bridge and then override the City to demolish five kilometres worth of housing and business to widen the arterial? Build a tunnel the width of Vancouver? Not a chance.
The only solution will be transit. But if the referendum fails, no money. And a world that looks like this:
.
How is that in even the most selfish driver’s interest?
.
* Which is actually remarkable growth. The rate of transit use went from 16.5 percent to 19.7 percent in Metro from 2006 to 2011 – a 19.3 percent increase. The population of the Metro Vancouver CMA increased by 196,747 people – a 9.3 percent increase. The rate of transit use increased at more than twice the rate of population growth.
** Weekday peak is the 60 minutes from 8-9 am. Private cars average 1.1 to 1.2 persons per car. Freeway capacity is 2,000 cars per hour per lane.


I distrust the data from the latest “household survey”. This is a voluntary survey. Earlier data in this series came from the Long Form Census – which was cancelled by Stephen Harper. That was a 10% mandatory collection of data.
Shelley Fralic does not make the decisions for this region. But right now Christy Clark seems to have the upper hand. Which might actually be a worse outcome.
Can we wrest back control over our own future?
here’s an alternative headline:
“BC government pouring billions into highways even though proportion of commuters making use of them declining”
IMO i’d agree with the need of a new (bridge) crossing at the Massey Tunnel. I can see a lot of sustainable upside:
-Commecial hazardous goods can use a bridge crossing instead of avoiding the tunnel. deltaport traffic has to divert to hwy 91 currently.
-acceptance of tolling. you can toll the existing infrastructure, but that will get people unhappier faster than the HST. we would also need to remember that road pricing is more for control of demand and adjusted accordingly.
-transit? at least putting in dedicated transit lanes would be a start.
130,000 people per day instead of 13,000 for the expo line into downtown I think you mean
Interesting that the to work numbers haven’t changed much but the individual trip trends have:
http://www.translink.ca/~/media/documents/about_translink/media/2012/2011%20metro%20van%20trip%20diary%20survey%20briefing%201.ashx
2008-2011
Population Up 6%
Growth percentages:
Cycling up 26%
Transit up 17%
Walking up 6%
Auto up 4%
Overall, the automobile (including auto driver and passenger) is the dominant mode of travel, accounting for
73% of trips in 2011. At the same time, the domination of the automobile has been declining from 77% in 1994.
This reduction of auto mode share is a result of a continuous decline in car passenger mode share combined
with stable auto driver mode share.
Transit is the next dominant mode at 14% of trip making which has generally been trending upward in the last
decade. The walk mode represents 11% of total trips which has remained relatively stable over the span of
travel surveys dating back to 1994. Finally, the bicycle mode accounts for just under 2% of total travel. While
cycling have the lowest mode share of the five main modes, its growth from 1.5% to 1.8% represents the largest
growth, percentage wise, between the last two Trip Diary surveys. Together, the walk, bike and transit mode
shares add up to 26.8%.
The survey doesn’t correlate with the trends from the Translink trip diary.
The Translink Trip Diary numbers you are reporting is for all trips. The NHS is for commute to work trips only. Of course mode shares will be different. If you can get ahold of the Trip Diary mode shares filtered for commute trips only, then you may see a better correlation between the two.
Actually, the NHS showed that the number of transit commuters in Metro Vancouver increased from 165,435 in the 2006 Census to 213,680 in 2011 – that’s a 29% increase, or three times the rate of population growth. Meanwhile, the number of people commuting by automobile in Metro Vancouver increased by just 2.9% over the same period.