
Just in case things can sometimes seem too bleak, it helps to remind ourselves that incremental change makes a difference. Here are some slides I saw the other day from a presentation that captures what the City of Vancouver has achieved in the last twenty years or so.
As the phrase goes: we overestimate what can be done in a year, and underestimate what can happen in a decade:

I had never seen the reduction in gasoline sales noted before. The transit increase of 50 percent is even more extraordinary than the increase in cycling, given that transit started from a high base to begin with, compared to most North American cities.
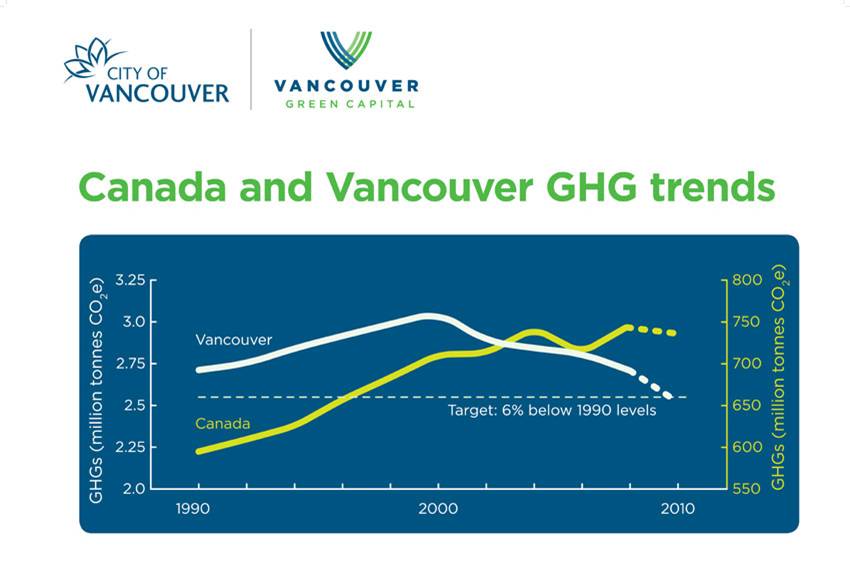
The results are also reflected in our ghg emissions:

No doubt quibbles and qualifications abound, but nonetheless, the lines are going in the right direction.


Yes it is impressive but why is the data so old? Cycling and walking have not been assessed since 2004, vehicle trips since 2005, gasoline sales since 2008.
Clive Rock used to say that the way we planned transport was like steering a ship by studying its wake. If the last time we looked was 8 years ago ….
I was wondering if you could post a link to the sources of the graphics as without that for all we know they could have been done by ‘Mike from Canmore,’ (hopefully at least one or two people will recognize the reference). That said I assume it is from a CoV source but would like to see the data and assumptions.
Yes, please!
As well it would be interesting to know what is being tracked. Is it km of travel? Daily trips?
PS: Mike may have seemed simplistic but he often had good insights! 🙂
Thanks for the post, Gordon. It was picked up on March 28, 2012 by the Sightline news service based in Seattle. If these numbers are for the City of Vancouver, it might be useful to clarify that the represents something under 30 per cent of the population of Metro Vancouver. The City is more densely built than many of the suburbs, and it pursues different and greener policies.
To show the extremes, a Metro Vancouver bulletin on 2006 census figures (http://bit.ly/H0teS8) shows 25 per cent of the active labour force in the City commuting by transit versus 3 per cent in the Township of Langley. Even so, good things are happening everywhere; the same bulletin shows a decrease in commute distances in almost every municipality. And one can hope that a new (2011) regional land use plan will reduce the momentum in favour of sprawl.
Any attempts to separate changes resulting from policy and from household financial realities?
Such as why people left their cars in favour of walking and biking in the period before the great recession, when unemployment was low and the banks hadn’t collapsed?
The GHG numbers are very misleading. If we all leased new, more efficient cars every year and dumped the old ones in the landfill, our average GHGs will go down. The problem is that the GHGs to manufacture the new cars are not accounted for. This extends to all products. If we buy a new iPad and LCD TV every year and dump old stuff, none of that is accounted for. As more people move to Vancouver, we tear down old houses and build bigger houses and condos. The new buildings may be more efficient, but their construction and building supplies are not accounted for, yet this will lower our GHG average. Flights at YVR continue to increase, and they are more and more are international. None of this is accounted for. Instead, we pat ourselves on the back for lowering GHGs by riding the Canada Line. As the boomer population ages and retires or becomes more “resort-ified”, less people will be working and commuting. Contrary, Surrey is growing with younger, working families, so their GHG numbers will increase just on the demographic shift alone.
Kind of difficult to say what’s been accounted for and what hasn’t since we don’t know the source of the data for the graph, wouldn’t you say?
It’s from here:
http://vancouver.ca/sustainability/climate_protection.htm
And this:
http://vancouver.ca/sustainability/documents/2008GHGInventoryMethodologiesDocument20091210.pdf
Someone who does a 100-mile diet and buys all their products from local manufacturers will have a higher GHG number than someone who eats bread flown into Vancouver from Paris every morning and buys everything from Amazon with overnight Fedex.
Thanks for the link Kirk. I hate to rain on the happy parade because I really wanted to have the good news story but everyone should read the Methodology document. Unfortunately saying, ‘the methodology is not very strict,’ is an understatement. The potentially saving grace is maybe previous reports were also sufficiently weak that the overall trend is still relevant.
Thanks, indeed, Kirk. Good to put some context to it.