
Clark Williams-Derry at the Sightline Institute detects a pattern:
… traffic volumes all around the Pacific Northwest are falling short of the projections made just a few years ago. Take a look at just a sampling of the evidence:
- The Golden Ears Bridge: Both traffic volumes and tolling revenue on this new bridge outside of Vancouver, BC are falling short of expectations, adding up to “a cumulative shortfall of $63.8 million since 2009 for a bridge that was supposed to pay itself off in 30 years,” according to the Maple Ridge Times.
- The Columbia River Crossing project: According to this analysis by Portland economist Joe Cortright, the number of cars taking the I-5 bridge between Portland, OR and Vancouver, WA “has declined every year after 2005.” The trends are almost the exact opposite of the transportation modelers’ predictions: “Traffic levels in the nearly five years since CRC forecasts were completed have declined by about 7,000 vehicles per day, rather than increasing by about 7,000 vehicles per day as forecast.”
- Seattle: According to a recent Seattle Times story, “the Seattle Department of Transportation…found traffic dropping from 920,000 average daily trips within city limits for 2008 (and 975,000 trips in 2003) to 900,000 trips in 2009.” This is roughly the same story we heard last year (see Publicola for news coverage, and the SDOT website for traffic maps). Of course, the numbers are a bit old now, and may be tied up in the effects of the recession.
- Portland: In greater Portland, OR, vehicle travel measured per person peaked in 1996, and has fallen by about 12 percent since then.
- Washington highways: From 1983 through 2000, total vehicle travel in the state had typically increased in the range of 2.5 to 6.5 percent per year — i.e., a lot. But after 2000, vehicle travel started growing much more slowly; and then it cratered in 2008, when gas prices soared and the economy soured. As a result, traffic volumes on state highways were lower in 2009 than in 2002. (See p. 47 of this pdf from WSDOT — but note that a change in methods may have affected the reported traffic between 2003 and 2004.)
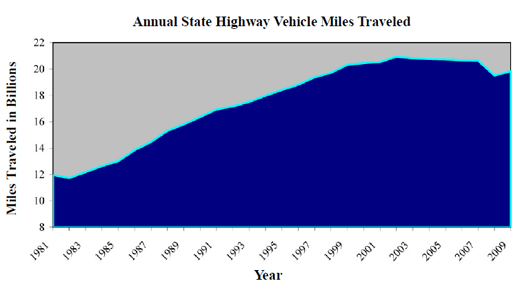
- Oregon highway system: In Oregon, traffic volumes — not just per person, but total miles logged on highways — peaked in 2002. VMTs fell slightly from 2002 through 2007, and then fell sharply in 2008. (See the chart below.)


that’s really interesting news, especially about the columbia river crossing – hopefully regional authorities will reconsider their highway megaproject and expand light rail across the river instead!
One of the reasons why traffic drops is due to recessions, which is verified by the above graph. No jobs = no commutes.
This is another great source for Vancouver, though hardly new, showing how much auto traffic has dropped since 1996 within city limits: http://vancouver.ca/commsvcs/planning/stats/travelwork/index.htm
The recession only sped up already existing trends. The underlying issues are much deeper than that, which is why car traffic peaked in 2002 in Oregon, and why car traffic has been on the decline in the city of Vancouver since 1996.
Nothing focuses the mind like $60 (and climbing) fill-up costs. Interestingly here in Victoria we set 2026 targets for non-auto mode share that were reached in 2006. With 46% of all city journey to work trips by either walking, cycling or transit, we are now tied with Montreal for the highest “sustainable” mode share in Canada (2006 census). Using places like Copenhagen as benchmarks of best practice we should aspire to meet now meet the A and the R of the SMART objective test.
Indeed. car use is far far too cheap in urban areas.
Only by increasing car costs will behavior change. I’d say: enter any city by car: $20, collected at major roads automatically, like in London, Stockholm or Singapore. Of course, in parallel, alternatives have to be provided, namely rapid transit.
BC also needs to change its strata act to decouple parking spaces from condos, like in Ontario. If a parking spot costs $40,000 people will think twice to buy one or two.
Onstreet parking needs to be far more expensive n cities everywhere as a road is not owned by the adjacent house owner. $12/day or $360/month if you wish to park you car on the street. This would clean up areas like Point Grey or any dense area where people use their garage for storage or a rental unit real fast.
But of course, no politician has the guts to propose such radical changes. They rather keep their cushy overpaid job with often defined benefit pensions to nibble at the status quo.
Over time, City of Vancouver based employers have relied on people from other municipalities for over 40% of their labour supply. It has decreased slightly in the last decade from about 47% to 43%, but the basic fact that Vancouver employers simply could not operate without labour supplied by other municipalities hasn’t changed.
@ Tessa:
Great link! Thanks!
I hadn’t seen this good news stat:
“From 1996 to 2006, almost all the growth in people travelling to jobs in Vancouver has been by transit, biking or walking and there was virtually no increase in car travel.”
It will be interesting to see how these numbers compare following the 2011 census. Or will it no longer be asking these questions?
If you wish for to grow your knowledge only
keep visiting this site and be updated with the latest news update posted here.