
This popped up in the email a few weeks ago from Dan Freeman, a transportation planner at TransLink:
I know it may come as a shock to some of you, but cool things do happen at TransLink…
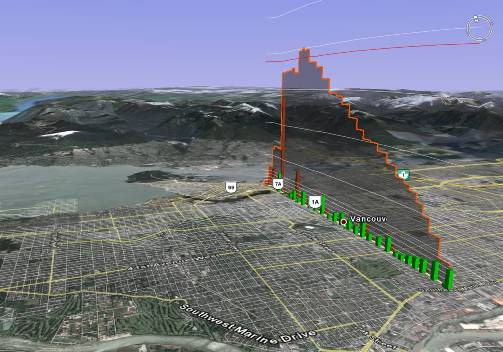
We’ve been doing some playing around with Google Earth as a platform for displaying passenger load profile data for almost a year now… One of my colleagues (Graeme Brown) devised a way to display our passenger load data in kml – the programming language for Google Earth. It allowed us to create some really cool 3D load profiles. We’re pretty excited about it, and we’re also pretty sure that no one else has done this before.
Graeme recently posted an example load profile (route #3 – Main St), along with a brief explanation of how to create it …
Take a look – it’s pretty cool – and send it along to other transit/transportation nerds you know who might be interested. We’d love to hear what you & others have to say, including suggestions to improve it.

You don’t have to be a data nerd to appreciate the importance of this. I remember, when I was a TransLink director, seeing some figures which showed that the daily ridership on just one trolley route – Fraser/Granville – was greater than the expected ridership of the proposed Evergreen light-rail line at its inauguration. (The visual display of this quantitative data would have made that apparent at a glance.)
Of course, the real difference was that Evergreen line would cost millions in capital and require significant operating subsidies, while the trolley routes paid for themselves.


The Evergreen Line is consistent with the goal of shaping growth by building rapid transit lines, like the streetcar lines of yesteryear did. “Build it and they will come”.
The problem of course is that if you build where there is the most ridership, then the suburban routes will never get a line, despite contributing significant amounts by way of taxes, and growth will not be “shaped”, leading to a potentially difficult growth pattern to deal with in the future.
Another thing is that I would expect that riders on the Fraser/Granville bus would be able to get to a destination (i.e. downtown) in about 30 minutes or so. That is a reasonable time frame.
You need to determine which deserves more attention, a large drop in travel time for a marginal (but increasing) number of riders, or a marginal drop in travel time for a large number of riders. Which service improvement is apt to encourage more riders versus the alternative of the status quo?